Processing Apache Druid Time Series Data in Apache Spark
Introduction
This article is about determining time series statistical correlation characteristics for stock market trading using Apache Spark and Apache Druid.
Apache Druid excels at sub-second queries over terabytes of timestamped data. Apache Spark offers rich library of analytical functions for SQL, stream and graph data out of the box.
However, as of time of this writing (April 2021), latest stable Apache Spark (v.3.1.1 and below) binary download does not offer connectivity to Apache Druid and this article would show the few simple steps to connect the two.
Basic Concepts
Purpose of time series modeling is forecasting or simulating data. Application domains are vast and we'll consider stock market trading in this issue. For example, trading strategy called Pairs Trade involves matching a long position with a short position in two stocks with a high correlation.
Pairs Trading
A pairs trade strategy is best deployed when a trader identifies a correlation discrepancy. Relying on the historical notion that the two securities will maintain a specified correlation, the pairs trade can be deployed when this correlation falters.
When pairs from the trade eventually deviate—as long as an investor is using a pairs trade strategy—they would seek to take a dollar matched the long position in the underperforming security and sell short the outperforming security. If the securities return to their historical correlation, a profit is made from the convergence of the prices.
Time Series Correlation
Here is how a correlation between time series can be determined.
Correlation is defined through statistical notions of Expectation, Variance and Covariance. The expected value or expectation, E(x), of a random variable is its mean average value in the population. We denote the expectation of x by µ, such that E(x) = µ .
Correlation is a dimensionless measure of how two variables vary together, or "co-vary". In essence, it is the covariance of two random variables normalised by their respective spreads. The (population) correlation between two variables is often denoted by :

The denominator product of the two spreads will constrain the correlation to lie within the interval [-1, 1]
- A correlation of +1 indicates exact positive linear association
- A correlation of 0 indicates no linear association at all
- A correlation of -1 indicates exact negative linear association
Tooling
Obviously, manually checking thousands of data points for the selected market stock instruments is not practical.
Apache Spark is a unified analytics engine for large scale data processing, with built-in support for data streaming, SQL, graphs and advanced analytics technics like Machine Learning .
While Apache Spark has native support for dozens of data file formats and SQL backends, time series data is stored in Apache Druid in our scenario .
Apache Druid is capable of storing terrabytes of time series data, rendering high performance access to this data via SQL and JSON queries. Such queries can be issued through several APIs, including JDBC. In our case, Apache Spark would load Avatica JDBC driver to connect to Apache Druid instance.
Dataset
We'd use Apache Spark to calculate statistical correlation between 2 market data time series in this simple example. These time series are daily closing prices for Microsoft and Amazon equity stock for the time period between 1997 and 2017.
Scouting stock market data for instruments with non-zero correlation is beyond the scope of this article, but can be built on the same platform.
Components Required
- Apache Druid 0.20.1
- Apache Spark (Local or Cluster modes) v.2.3.4
- Avatica JDBC Driver v.1.8
- Jupyther Notebook or Hue
Implementation
Note Web v.7.18 provides all of the listed components setup in a Docker/Kubernetes environment. So we 'd leave out the steps for downloading and deploying Apache Spark and Apache Druid. However, we'd show:
- data ingestion from HDFS into Apache Druid
- Apache Spark accessing time series data in Apache Druid via JDBC
- calculating Pearson correlation for the 2 equity stock market closing price time series
if performing tutorial steps on a self hosted Apache Spark instance, you'd need to download and install Calcite Avatica's JDBC driver version 1.8: https://mvnrepository.com/artifact/org.apache.calcite.avatica/avatica/1.8.0
Data Ingestion
In a production scenario you can get free historic stock market data via API or files from providers like Yahoo Finance, Investopedia or WSJ . We'd use a few samples from Kaggle for this demo case.
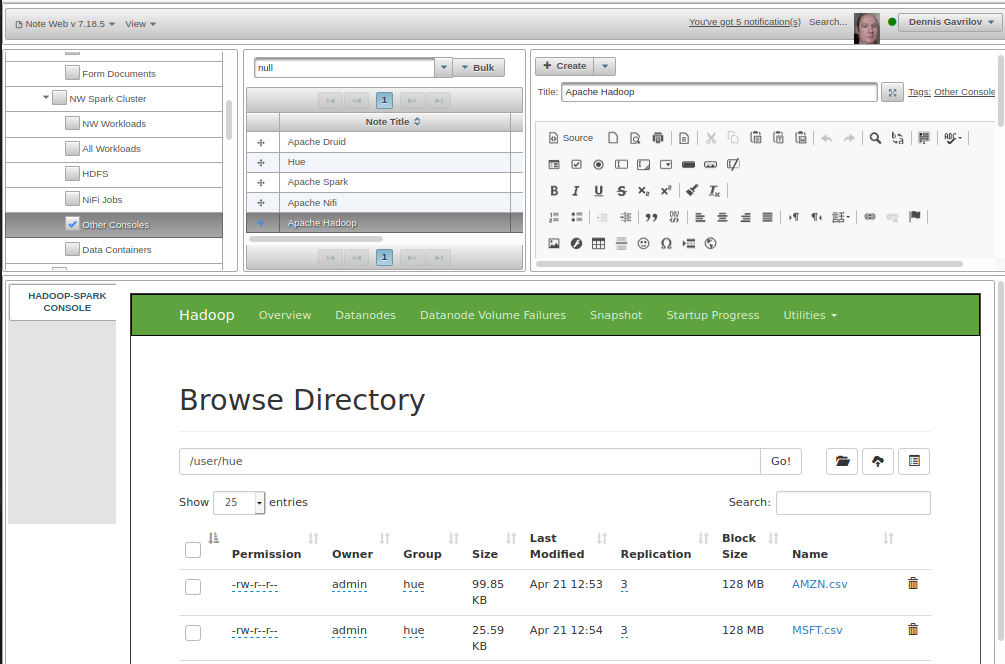
Apache Druid supports ingestion from data stored in public clouds (AWS, Azure, GCP), Kafka, Hadoop or plain HTTP. We'd use Hadoop for this case. Place the files onto HDFS using a command line or web console. Note Web v.7.18 supports this activity with tag "NW Spark Cluster / Consoles", web notes "Hue Console" or "Hadoop Console". Console represented by selected web note would be rendered in NW's Content Panel.
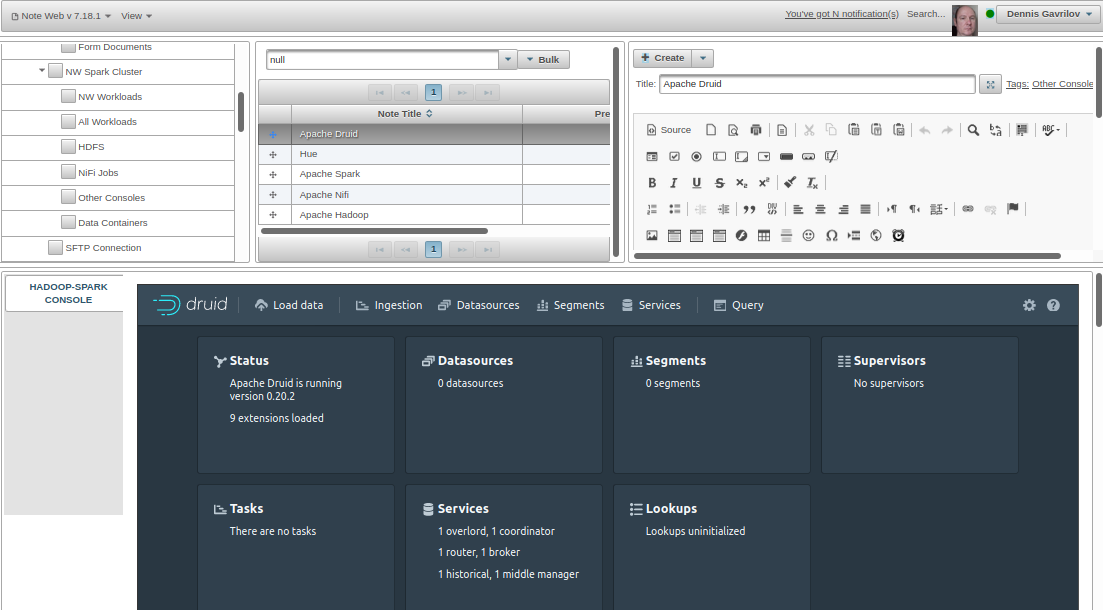
Navigate to Apache Druid's console, by default accessible on port 8888 where Coordinator process runs. In Note Web v.7.18 this can be achieved by clicking on "NW Spark Cluster / Consoles" tag and selecting web note "Apache Druid Console".
Click ellipsis icon in Tasks area of Ingestion tab to submit a JSON task:
"type": "index_parallel",
"id": "index_parallel_market_stock_equity_flhfkpji_2021-05-03T13:57:46.171Z",
"groupId": "index_parallel_market_stock_equity_flhfkpji_2021-05-03T13:57:46.171Z",
"resource": {
"availabilityGroup": "index_parallel_market_stock_equity_flhfkpji_2021-05-03T13:57:46.171Z",
"requiredCapacity": 1
},
"spec": {
"dataSchema": {
"dataSource": "market_stock_equity",
"timestampSpec": {
"column": "Date",
"format": "M/d/yyyy",
"missingValue": null
},
"dimensionsSpec": {
"dimensions": [{
"type": "double",
"name": "Adj Close",
"multiValueHandling": "SORTED_ARRAY",
"createBitmapIndex": false
},
{
"type": "string",
"name": "Stock",
"multiValueHandling": "SORTED_ARRAY",
"createBitmapIndex": true
}
],
"dimensionExclusions": [
"Date"
]
},
"metricsSpec": [],
"granularitySpec": {
"type": "uniform",
"segmentGranularity": "DAY",
"queryGranularity": "HOUR",
"rollup": true,
"intervals": [
"1997-05-05T00:00:00.000Z/2017-09-09T00:00:00.000Z"
]
},
"transformSpec": {
"filter": null,
"transforms": [{
"type": "expression",
"name": "Stock",
"expression": "'AMZN'"
}]
}
},
"ioConfig": {
"type": "index_parallel",
"inputSource": {
"type": "hdfs",
"paths": [
"hdfs://noteweb-hadoop-namenode:9000/user/hue/AMZN.csv"
]
},
"inputFormat": {
"type": "csv",
"columns": [],
"listDelimiter": null,
"findColumnsFromHeader": true,
"skipHeaderRows": 0
},
"appendToExisting": true
},
"tuningConfig": {
"type": "index_parallel",
"maxRowsPerSegment": 5000000,
"maxRowsInMemory": 1000000,
"maxBytesInMemory": 0,
"maxTotalRows": null,
"numShards": null,
"splitHintSpec": null,
"partitionsSpec": {
"type": "dynamic",
"maxRowsPerSegment": 5000000,
"maxTotalRows": null
},
"indexSpec": {
"bitmap": {
"type": "roaring",
"compressRunOnSerialization": true
},
"dimensionCompression": "lz4",
"metricCompression": "lz4",
"longEncoding": "longs",
"segmentLoader": null
},
"indexSpecForIntermediatePersists": {
"bitmap": {
"type": "roaring",
"compressRunOnSerialization": true
},
"dimensionCompression": "lz4",
"metricCompression": "lz4",
"longEncoding": "longs",
"segmentLoader": null
},
"maxPendingPersists": 0,
"forceGuaranteedRollup": false,
"reportParseExceptions": false,
"pushTimeout": 0,
"segmentWriteOutMediumFactory": null,
"maxNumConcurrentSubTasks": 1,
"maxRetry": 3,
"taskStatusCheckPeriodMs": 1000,
"chatHandlerTimeout": "PT10S",
"chatHandlerNumRetries": 5,
"maxNumSegmentsToMerge": 100,
"totalNumMergeTasks": 10,
"logParseExceptions": true,
"maxParseExceptions": 2147483647,
"maxSavedParseExceptions": 0,
"buildV9Directly": true,
"partitionDimensions": []
}
},
"context": {
"forceTimeChunkLock": true
},
"dataSource": "market_stock_equity"
}
{
"type": "index_parallel",
"id": "index_parallel_market_stock_equity_pdgieeke_2021-05-03T13:56:54.555Z",
"groupId": "index_parallel_market_stock_equity_pdgieeke_2021-05-03T13:56:54.555Z",
"resource": {
"availabilityGroup": "index_parallel_market_stock_equity_pdgieeke_2021-05-03T13:56:54.555Z",
"requiredCapacity": 1
},
"spec": {
"dataSchema": {
"dataSource": "market_stock_equity",
"timestampSpec": {
"column": "Date",
"format": "M/d/yyyy",
"missingValue": null
},
"dimensionsSpec": {
"dimensions": [{
"type": "double",
"name": "Adj Close",
"multiValueHandling": "SORTED_ARRAY",
"createBitmapIndex": false
},
{
"type": "string",
"name": "Stock",
"multiValueHandling": "SORTED_ARRAY",
"createBitmapIndex": true
}
],
"dimensionExclusions": [
"Date"
]
},
"metricsSpec": [],
"granularitySpec": {
"type": "uniform",
"segmentGranularity": "DAY",
"queryGranularity": "HOUR",
"rollup": true,
"intervals": [
"1997-05-05T00:00:00.000Z/2017-09-09T00:00:00.000Z"
]
},
"transformSpec": {
"filter": null,
"transforms": [{
"type": "expression",
"name": "Stock",
"expression": "'MSFT'"
}]
}
},
"ioConfig": {
"type": "index_parallel",
"inputSource": {
"type": "hdfs",
"paths": [
"hdfs://noteweb-hadoop-namenode:9000/user/hue/MSFT.csv"
]
},
"inputFormat": {
"type": "csv",
"columns": [],
"listDelimiter": null,
"findColumnsFromHeader": true,
"skipHeaderRows": 0
},
"appendToExisting": true
},
"tuningConfig": {
"type": "index_parallel",
"maxRowsPerSegment": 5000000,
"maxRowsInMemory": 1000000,
"maxBytesInMemory": 0,
"maxTotalRows": null,
"numShards": null,
"splitHintSpec": null,
"partitionsSpec": {
"type": "dynamic",
"maxRowsPerSegment": 5000000,
"maxTotalRows": null
},
"indexSpec": {
"bitmap": {
"type": "roaring",
"compressRunOnSerialization": true
},
"dimensionCompression": "lz4",
"metricCompression": "lz4",
"longEncoding": "longs",
"segmentLoader": null
},
"indexSpecForIntermediatePersists": {
"bitmap": {
"type": "roaring",
"compressRunOnSerialization": true
},
"dimensionCompression": "lz4",
"metricCompression": "lz4",
"longEncoding": "longs",
"segmentLoader": null
},
"maxPendingPersists": 0,
"forceGuaranteedRollup": false,
"reportParseExceptions": false,
"pushTimeout": 0,
"segmentWriteOutMediumFactory": null,
"maxNumConcurrentSubTasks": 1,
"maxRetry": 3,
"taskStatusCheckPeriodMs": 1000,
"chatHandlerTimeout": "PT10S",
"chatHandlerNumRetries": 5,
"maxNumSegmentsToMerge": 100,
"totalNumMergeTasks": 10,
"logParseExceptions": true,
"maxParseExceptions": 2147483647,
"maxSavedParseExceptions": 0,
"buildV9Directly": true,
"partitionDimensions": []
}
},
"context": {
"forceTimeChunkLock": true
},
"dataSource": "market_stock_equity"
}
Click Submit button to tell Apache Druid to ingest previously uploaded data. Repeat the same for the Microsoft stock closing prices file.
New tasks called like "index_parallel_market_history_tuned_..." would appear with status "WAITING". Wait until task changes its status to "RUNNING" and then "WAITING" again.
Click "Datasources" tab to see new datasource "market_equity_historic".
Please consider that new and changed .csv files placed into task's HDFS directory (hdfs://noteweb-hadoop-namenode:9000/user/hue/ corresponding to name masks MSFT*.csv AMZN*.csv ) would be ingested by Apache Druid and made available for queries automatically going forward.
Let's see how much data of what we've ingested is available for correlation analysis:
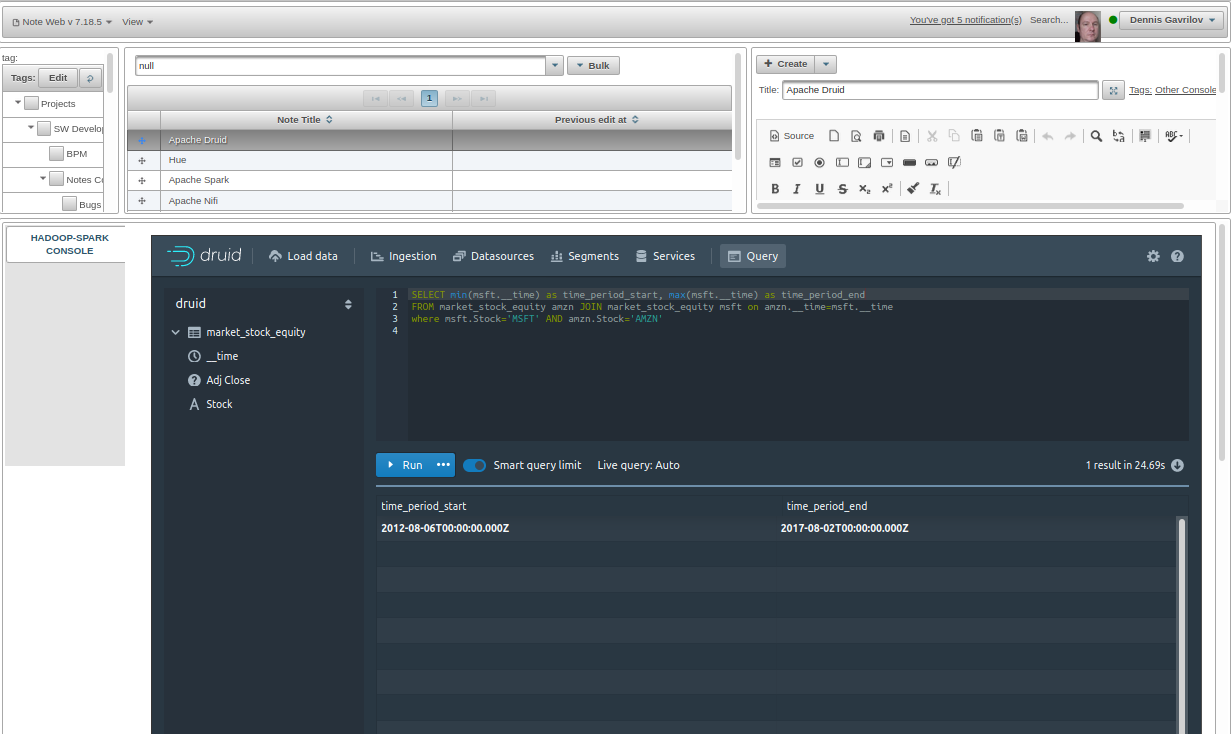
So we have a time period with sufficient coverage for both time series (Closing prices for MSFT and AMZN) between 2012-08-06 and 2017-08-02 . So any range between these dates can be easily analysed for correlation.
Calculating Time Series Correlation
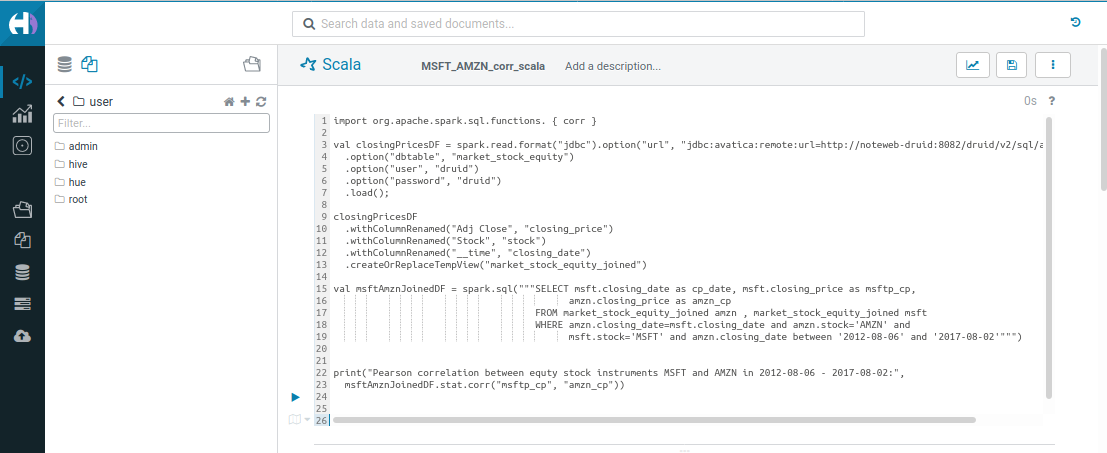
As often with Apache Spark, you can submit data processing commands in Scala, Python or R from Hue or Jupyter or directly from corresponding Spark consoles (spark-shell, pyspark, sparkR or spark-sql):
Scala
import org.apache.spark.sql.functions.{corr}
val closingPricesDF = spark.read
.format("jdbc")
.option(
"url",
"jdbc:avatica:remote:url=http://noteweb-druid:8082/druid/v2/sql/avatica/"
)
.option("dbtable", "market_stock_equity")
.option("user", "druid")
.option("password", "druid")
.load();
closingPricesDF
.withColumnRenamed("Adj Close", "closing_price")
.withColumnRenamed("Stock", "stock")
.withColumnRenamed("__time", "closing_date")
.createOrReplaceTempView("market_stock_equity_joined")
val msftAmznJoinedDF = spark.sql(
"""SELECT msft.closing_date as cp_date, msft.closing_price as msftp_cp,
amzn.closing_price as amzn_cp
FROM market_stock_equity_joined amzn , market_stock_equity_joined msft
WHERE amzn.closing_date=msft.closing_date and amzn.stock='AMZN' and
msft.stock='MSFT' and amzn.closing_date between '2012-08-06' and '2017-08-02'"""
)
print(
"Pearson correlation between equty stock instruments MSFT and AMZN in 2012-08-06 - 2017-08-02:",
msftAmznJoinedDF.stat.corr("msftp_cp", "amzn_cp")
)
Python
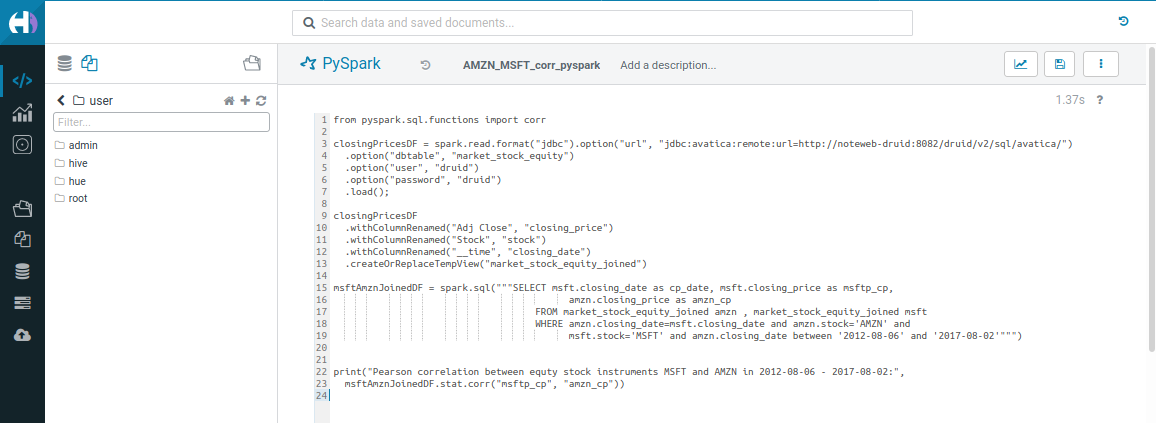
from pyspark.sql.functions import corr
closingPricesDF = (
spark.read.format("jdbc")
.option(
"url", "jdbc:avatica:remote:url=http://noteweb-druid:8082/druid/v2/sql/avatica/"
)
.option("dbtable", "market_stock_equity")
.option("user", "druid")
.option("password", "druid")
.load()
)
closingPricesDF.withColumnRenamed("Adj Close", "closing_price").withColumnRenamed(
"Stock", "stock"
).withColumnRenamed("__time", "closing_date").createOrReplaceTempView(
"market_stock_equity_joined"
)
msftAmznJoinedDF = spark.sql(
"""SELECT msft.closing_date as cp_date, msft.closing_price as msftp_cp,
amzn.closing_price as amzn_cp
FROM market_stock_equity_joined amzn , market_stock_equity_joined msft
WHERE amzn.closing_date=msft.closing_date and amzn.stock='AMZN' and
msft.stock='MSFT' and amzn.closing_date between '2012-08-06' and '2017-08-02'"""
)
print(
"Pearson correlation between equty stock instruments MSFT and AMZN in 2012-08-06 - 2017-08-02:",
msftAmznJoinedDF.stat.corr("msftp_cp", "amzn_cp"),
)
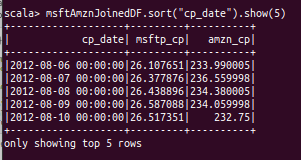
Having run the code above we retain variables in the session (setup by Apache Livy, if running from Hue, or by corresponding console if running directly). So we can investigate data further using data frames setup by code specified above:

Conclusion
Sources listed in references below [1], state that Pearson correlation coefficient above 0.8 is indication to consider instruments for Pair Trading. Deciding if relatively high correlation of 0.9375 between AMZN and MSFT stock is due the fact that both are global large established players on HiTech market with partially overlapping product and services portfolios or a mere coincidence, if this discovery is worth further consideration is out of scope of this article.
However, you can certainly use Apache Spark to take this bit of research further and develop the few lines of Scala/Python/R needed:
- to identify less expected pairs in HiTech and other markets, possibly cross-region, using more recent closing prices out of hundreds of stock equity instruments
- to apply advanced analytics tooling of Apache Spark to large volumes of time stamped data in Apache Druid, should the Apache Spark SQL engine Catalyst appear to be inferior to that of Apache Druid for your source data format and other requirements
Should you rather skip setting up the self-hosted Apache Spark instance, or Apache Hadoop or Apache Druid along with required connectivity just to check these or a few other Data Science ideas of yours, don't hesitate to email support@noteinweb.com and sign up for Note Web beta-testing.
References
- https://blog.quantinsti.com/pairs-trading-basics/
- https://druid.apache.org/docs/latest/tutorials/tutorial-batch.html
- https://www.kaggle.com/praxitelisk/financial-time-series-datasets
- https://www.quantstart.com/articles/Serial-Correlation-in-Time-Series-Analysis/
- https://www.investopedia.com/terms/p/pairstrade.asp
- https://www.r-bloggers.com/2021/01/example-of-pairs-trading/
- https://www.quantshare.com/sa-620-10-new-ways-to-download-historical-stock-quotes-for-free
- https://www.red-gate.com/simple-talk/blogs/statistics-sql-pearsons-correlation/
Note In Web, Inc. © September 2022-2026; Denys Havrylov Ⓒ 2018-August 2022